abstract data visualization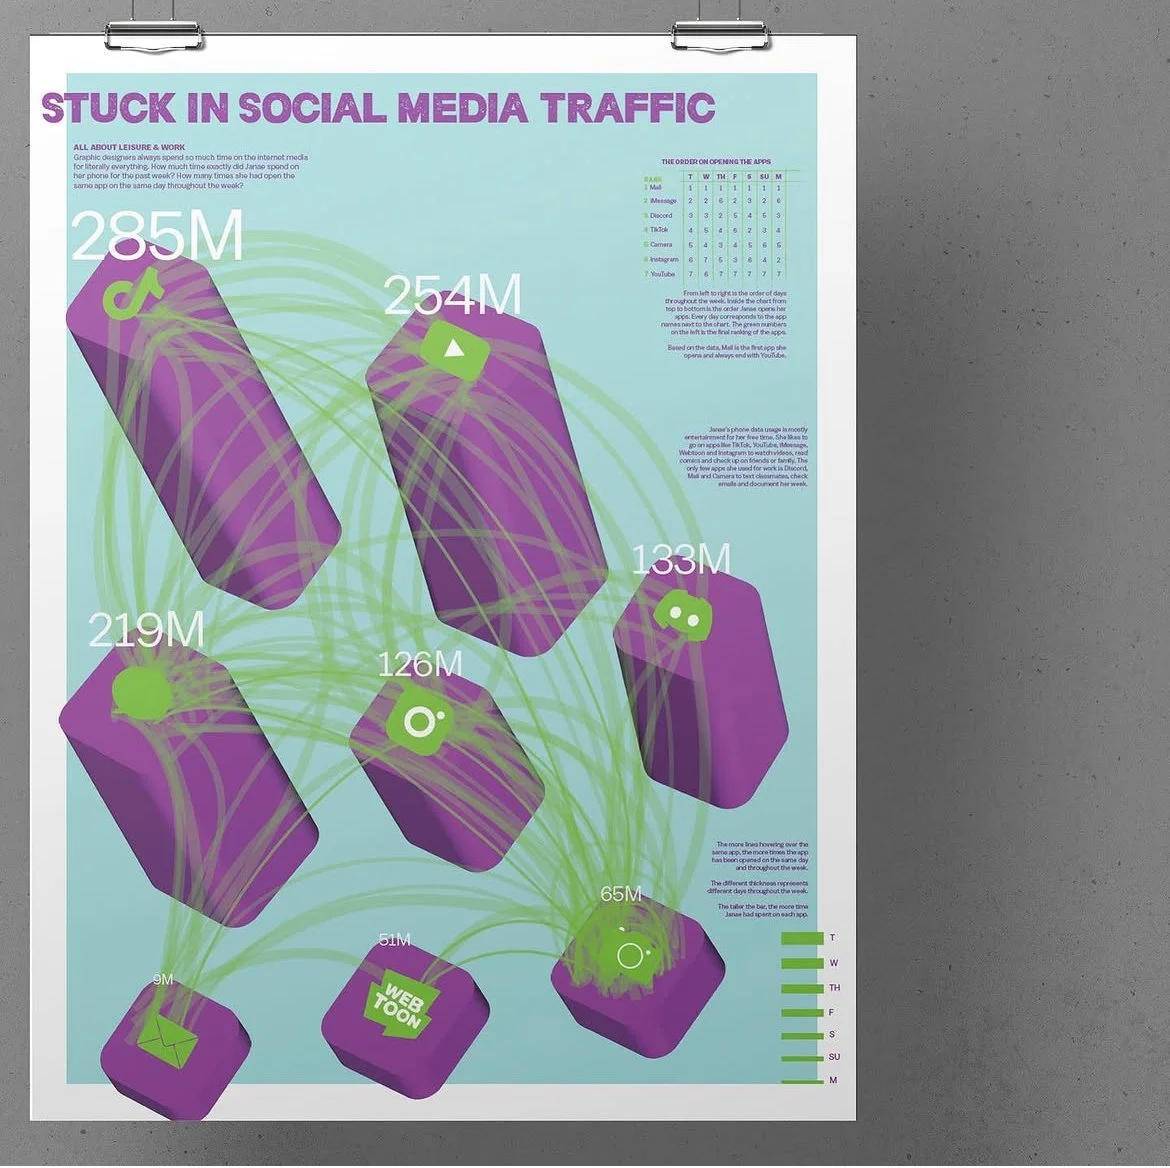
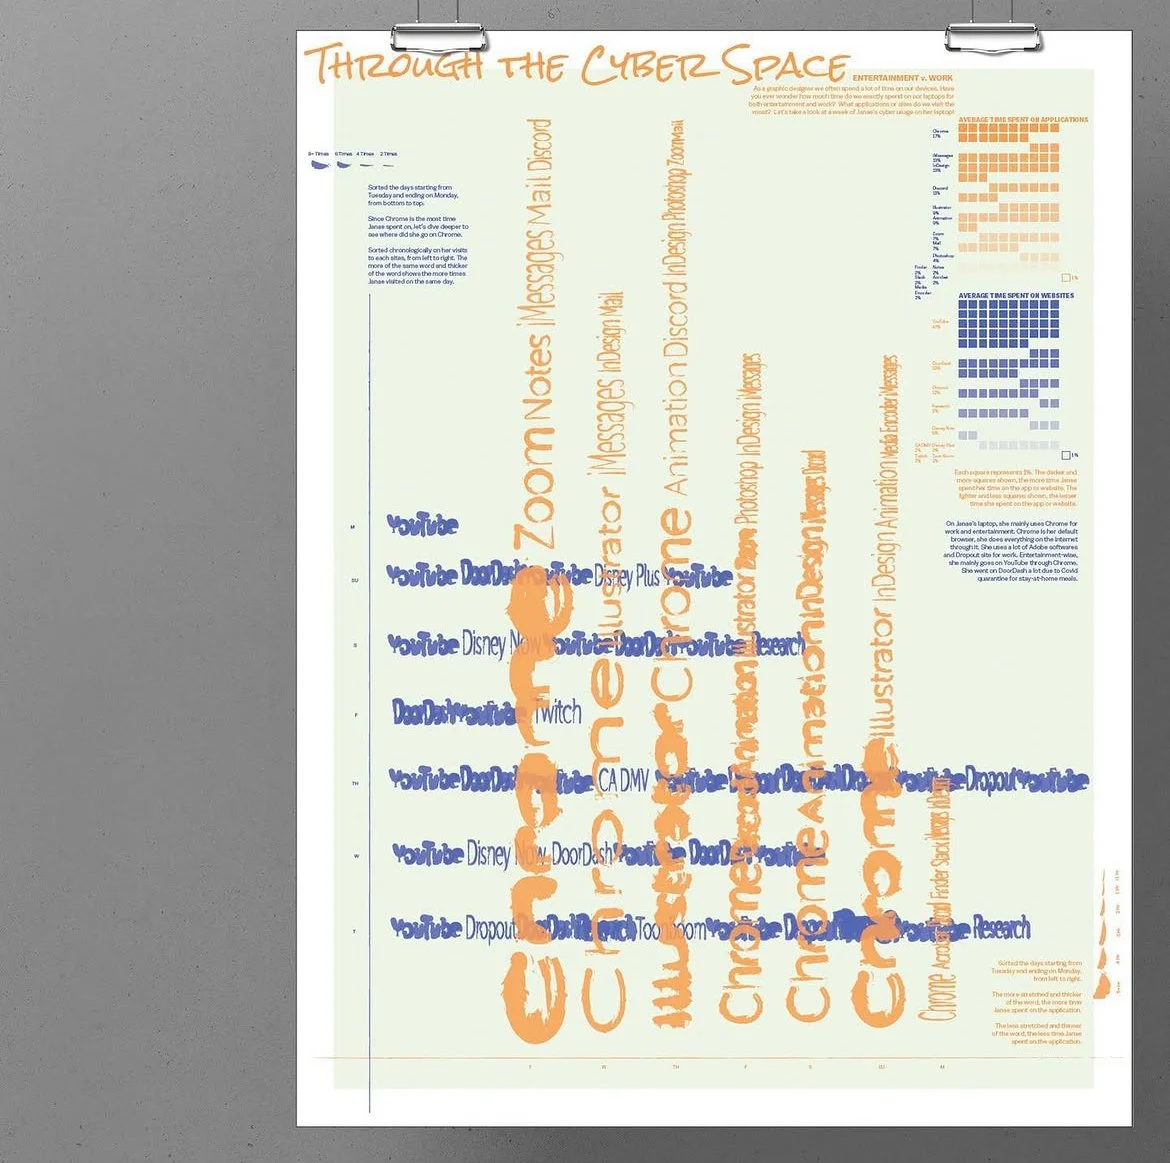
In this research-driven data project, I tracked and analyzed my classmates' daily mobile usage patterns to uncover the habits behind their screen time. I translated this raw data into two distinct illustrated infographics—"Through the Cyber Space" and "Stuck in Social Media Traffic"—using creative data visualization to explore the digital landscapes we inhabit. The project blends meticulous data collection with narrative illustration to highlight the intersection of human behavior and digital consumption.
San José State University Individual Project DSGD 120 - Exhibition
Fall ‘23
Programs:
Adobe Photoshop, Adobe Illustrator